Tallying Christmas Temperatures - Math Lesson

santa-in-canoe.jpg

Tallying Christmas Temperatures provides a quick review of converting temperatures from degrees Fahrenheit to degrees Celsius.  The head elf, Amos, has provided his secret formulas for converting these degrees.  It seems that he forgot to fill out his award-winning chart, recording the temperatures in both Celsius and Fahrenheit at key stops, Santa made on his trip around the world.  Help Amos complete his record that is straight “FROM THE DESK OF SANTA”.

Click here to download the complete worksheet for free

Angles Lesson Plan: Design your own Mini Golf Course

mini golf.PNG

Thanks to Jarrod Sing for submitting this great lesson plan.

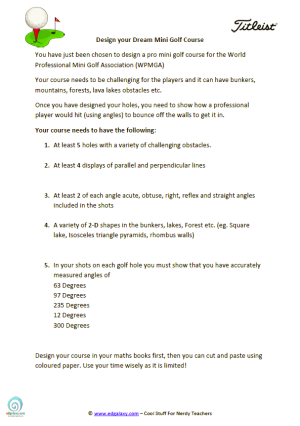
You have just been chosen to design a pro mini golf course for the World Professional Mini Golf Association (WPMGA)

Your course needs to be challenging for the players and it can have bunkers, mountains, forests, lava lakes obstacles etc.

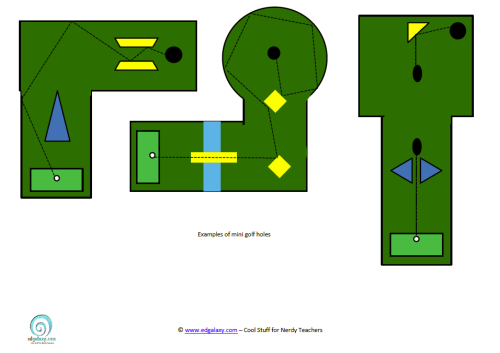
Once you have designed your holes, you need to show how a professional player would hit (using angles) to bounce off the walls to get it in.

Your course needs to have the following:

Click here to download the entire Printable PDF of this activity including examples.

  At least 4 displays of parallel and perpendicular lines

 At least 2 of each angle acute, obtuse, right, reflex and straight angles included in the shots

In your shots on each golf hole you must show that you have accurately measured angles of

63 Degrees

97 Degrees

235 Degrees

12 Degrees

300 Degrees

mini golf maths 2.PNG

TED-ED Pick of the Week: Why the shape of your TV Matters

Watching a movie at home isn’t quite the same experience as seeing it at a movie theater -- but why? Learn how changes in aspect ratio affect every film, and why your television might not be delivering the whole picture.

There is a great deal of science and maths associated with this lesson that can be applied to the classroom such as ration and percentages.

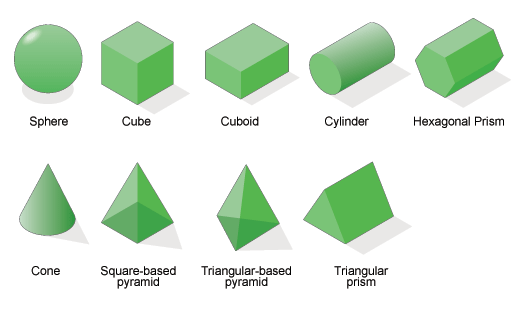
Great collection of 3D shape Nets to Print and Make

3D_shape_nets.gif

Creating 3D shapes from a 2D net is a really important process for students to understand.  It opens the door to discussing various aspects of geometry and looking at the properties of 3D shapes such as faces, vertices and edges.

This collection of 3D shape nets can be used in classes of all age groups to teach geometry and shape. 

EXCELLENT TOOL FOR TEACHING FRACTIONS, DECIMALS, RATIOS & PERCENTAGES.

This Excel workbook is an excellent tool for using with your interactive whiteboard to explain the mathematical links between fractions, decimals ratios and percentages.

Here are some suggestions for how you might use it in the classroom.

How Many Shaded: Show the students the workbook with no red squares shaded and one or more of the fraction, ratio, decimal and percentage showing.  Ask students how many squares need to be shaded to make 25% for example.  Get one student to come to the board to add the squares to check.  Repeat for different grid sizes and values.

Equivalent Fractions:  Show the students the workbook with no red squares shaded and the fraction showing.  Ask students how many squares need to be shaded to make 1/2 for example.  Get one student to come to the board to add the squares, look at the fraction the click simplify to check.  Repeat for different grid sizes, then for different fractions.  Ask questions such as "Can we shade in 1/3 of the grid?  If not why not?"

Investigate:  In a computer lab, get the students to open up the workbook.  Ask them to show the fraction and ratio cells and to investigate the relationship between the fractions and ratios for various grid sizes and a different number of squares shaded.  Tell them that they can use the simplify button or calculator whenever they want.  Tell them that they will have to write, present or discuss their findings.  Ask the what the simplify button does, etc.  This activity could also be used to investigate the relationship between fraction and decimal, etc. 

Download it here.- Remember to Enable Macros to make it work correctly.

Free Classroom Poster: Quadrilaterals

Here is another great math poster to decorate your classroom.  Today's poster is about quadrilaterals and illustrates the six major quadrilateral shapes.

Quadrilateral just means "four sides" (quad means four, lateral means side).  Any four-sided shape is a Quadrilateral.   The sides have to be straight, and it has to be 2-dimensional.

Quadrilaterals are simple (not self-intersecting) or complex (self-intersecting), also called crossed. Simple quadrilaterals are either convex or concave.

The interior angles of a simple quadrilateral ABCD all add up to 360 degrees of arc,

Anyhow, there are some facts on quadrilaterals, you can download this great poster here.

* Please note all of our posters are originally designed using high resolution images and fonts at A3 paper size. Be aware it will be automatically resized to your default paper size when using Adobe Acrobat Reader without any loss of quality. If you would like to print these documents at larger sizes you can read the Adobe Resize & Scaling FAQ here.

Finally if you would like to purchase a completely editable version of this document to alter without any restrictions you can purchase it for $10.00 simply by emailing us.

Classic Printable Battleship Game for Students

Battleship is a classic game of strategy and logic kids of all ages love to play.  Best of all, it is a great to play in your maths class as it teaches students how to use a cartesian plane and understand how to use co-ordinates on a grid.

I have made up two PDF versions of the classic battleship game you can download and print

The first one is the traditional battleship game and the second one is the slightly more advanced 4 quadrant version of Battleship which is more suited to secondary students.

"You just sunk my Battleship!"

Enjoy

Olympic Learning Countdown, Olympic Maths Video Lesson

This video lesson shows how Year 4 children go out into the play ground to try out Olympic Maths They measure and record long jumps, high jumps and target practice using a beanbag. They then turn their data into Venn diagrams and graphs for analysis to find their Olympic Maths Champions. At the same time they use digital cameras to record their efforts both in stills and in video footage. These can then be reviewed on the whiteboard.

You can use this video in three ways. If you like it and it fits your pupils then why not try the actual lesson: there is a lesson plan and other materials below. You could adapt it for your subject and age group or you might find it jogs you into trying something entirely different.