Teach your students how to create and interpret bar graphs
/Learning Intention / Overview
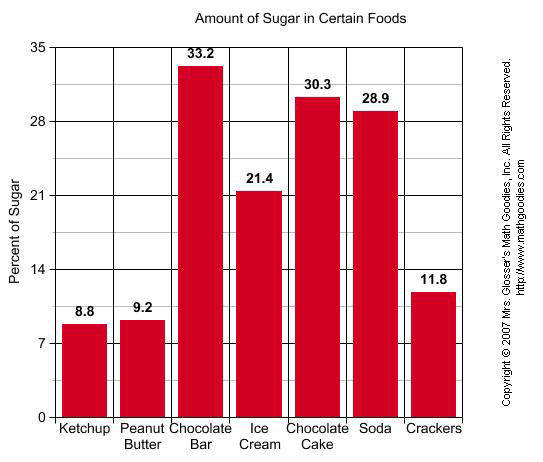
In this activity students will develop an understanding of bar graphs. A bar graph uses horizontal or vertical bars to organize and display data for quick easy generalizations. The bars represent amounts or qualities of things being compared.
Methods / Teaching Strategies
Individual Practice
Group Discussion
Personalized Learning Task
Assessment of Learning
Bar Graph Sheet (included)
Individualized Learning (Student Bar Graphs)
Performance Task 1 and 2


