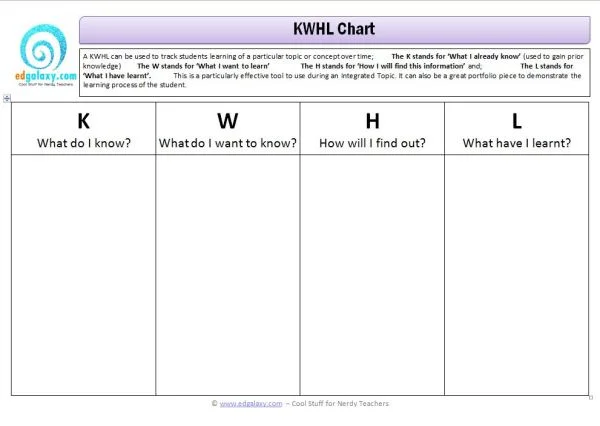
PMI Chart: Plus, Minus, Interesting - Thinking Tool

PMI-Chart.JPG

A PMI chart is an effective reflection tool to allow students to look at the whole picture of an event. It allows you to look at the positives, the minuses and what are some interesting factors. You could use a PMI individually, with a partner, small groups or in whole class discussions. This procedure could be implemented after Literacy Teams, after playing team games, after reading an information book or at the end of an integrated topic.

Download the PMI here

Fish Bone Thinking Tool

Fish-Bone-Thinking-Tool.JPG

Purpose: A fish bone is separated by a horizontal line, where you can have positive and negative arguments on each side of the horizontal line. You can then create sub heading for each argument where they list more facts based on this topic. You can also use it in a simpler way to list words about a topic too.

for/against arguments for a debate or persuasive writing positive/ negative statements for reflections planning for weekend writing – Saturday / Sunday planning ideas for a writing piece.

Downlaod the Fish Bone Tool here

Flow Chart

Flow Chart-Thinking-Tool.JPG

Purpose: A flow chart can be used to sequentially order ideas or events. It is easily adaptable to extend student learning and can be used in many different learning areas. This is a popular tool to use when planning a recount reflection for writing or when exploring the life cycle of animals etc.

Download the Flow Chart Here

Excitement Graph

Excitement-Graph.JPG
< p>Hello, World!

An excitement graph can be used when reading a story or recounting an event to track how excitement changes over time. It allows students to show their knowledge of the events that took place, while also showing their thoughts about them happening. Events are shown in a sequenced order horizontally.  The graph could also be adapted to show enjoyment or engagement over time as well.

Download the Excitement Graph Here

The KWHL Chart

KWHL-Chart.JPG

A KWHL can be used to track students learning of a particular topic or concept over time; The K stands for ‘What I already know’ (used to gain prior knowledge) The W stands for ‘What I want to learn’ The H stands for ‘How I will find this information’ and; The L stands for ‘What I have learnt’. This is a particularly effective tool to use during an Integrated Topic. It can also be a great portfolio piece to demonstrate the learning process of the student.

Download the KWHL Chart Here

The Brainstorm thinking tool

Brainstorm-Tool.JPG

A brainstorm is great tool to use to allow students to draw or write down their thinking about a topic. You need to write down the topic in the middle of the page. They then draw lines coming out of the middle. Connecting each line is key words about the topic. You can then have more branches coming off from these ideas. A tool for planning writing, reflecting on an excursion, or use sharing knowledge about a mathematical concept.  You can draw and write your ideas.

Download the Tool Here