KWHL Chart - Thinking Tool

KWHL-Chart.JPG

Hello, World!

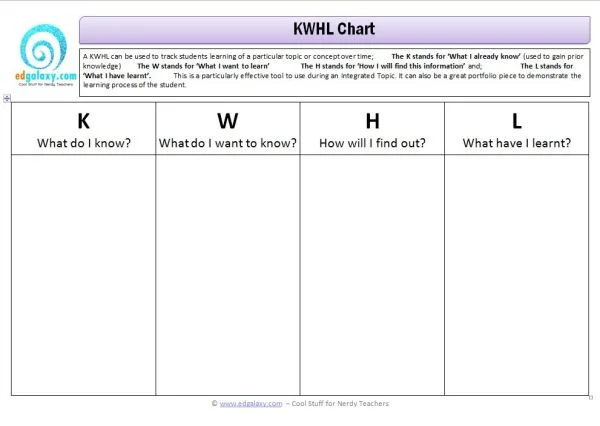
A KWHL can be used to track students learning of a particular topic or concept over time;

  • The K stands for ‘What I already know’ (used to gain prior knowledge)
  • The W stands for ‘What I want to learn’
  • The H stands for ‘How I will find this information’ and;
  • The L stands for ‘What I have learnt’. This is a particularly effective tool to use during an Integrated Topic.

It can also be a great portfolio piece to demonstrate the learning process of the student.

Download KWHL Chart

Thinking Tool - Linking Ideas

linking.JPG

Hello, World!

Linking involves making connections to other ideas or concepts. Examples could include thinking of a similar sounding word to find the spelling of an unknown word or sharing a personal experience that relates to a topic being discussed in class. ‘Piggybacking’ is also an example of linking where you link on a question or comment to one that has been mentioned recently. The template below can be used to help student develop links.

Lotus Chart - Thinking Tool

Lotus-Chart.JPG

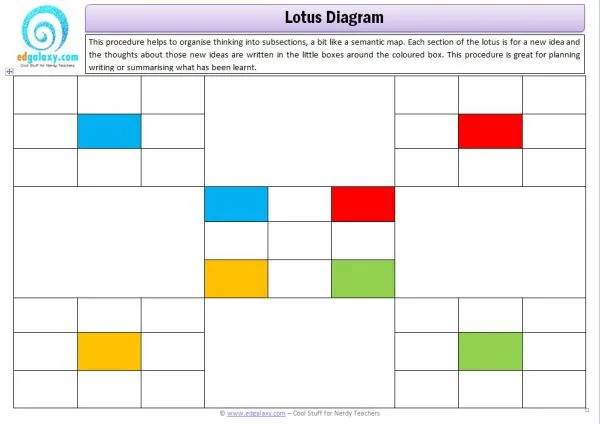
This procedure helps to organise thinking into subsections, a bit like a semantic map. Each section of the lotus is for a new idea and the thoughts about those new ideas are written in the little boxes around the coloured box. This procedure is great for planning writing or summarising what has been learnt.

Download the Lotus Chart Here

PMI Chart: Plus, Minus, Interesting - Thinking Tool

PMI-Chart.JPG

A PMI chart is an effective reflection tool to allow students to look at the whole picture of an event. It allows you to look at the positives, the minuses and what are some interesting factors. You could use a PMI individually, with a partner, small groups or in whole class discussions. This procedure could be implemented after Literacy Teams, after playing team games, after reading an information book or at the end of an integrated topic.

Download the PMI here

Fish Bone Thinking Tool

Fish-Bone-Thinking-Tool.JPG

Purpose: A fish bone is separated by a horizontal line, where you can have positive and negative arguments on each side of the horizontal line. You can then create sub heading for each argument where they list more facts based on this topic. You can also use it in a simpler way to list words about a topic too.

for/against arguments for a debate or persuasive writing positive/ negative statements for reflections planning for weekend writing – Saturday / Sunday planning ideas for a writing piece.

Downlaod the Fish Bone Tool here

Flow Chart

Flow Chart-Thinking-Tool.JPG

Purpose: A flow chart can be used to sequentially order ideas or events. It is easily adaptable to extend student learning and can be used in many different learning areas. This is a popular tool to use when planning a recount reflection for writing or when exploring the life cycle of animals etc.

Download the Flow Chart Here

Excitement Graph

Excitement-Graph.JPG
< p>Hello, World!

An excitement graph can be used when reading a story or recounting an event to track how excitement changes over time. It allows students to show their knowledge of the events that took place, while also showing their thoughts about them happening. Events are shown in a sequenced order horizontally.  The graph could also be adapted to show enjoyment or engagement over time as well.

Download the Excitement Graph Here

The 5 Whys Thinking Tool

the-5-whys-tool.JPG

The 5 Why’s procedure can be used for any activity when you want tease out different reasons for completing a task or why something did/did not happen?

It allows students to be able to form a series of answers for a certain activity and demonstrates several different points of view.

Download the 5 Whys thinking Tool Here